Setting Up Kibana For ElasticSearch
Posted By : Himani Mishra | 20-Apr-2020
Kibana is an open-source data visualization dashboard for Elasticsearch and exploration tool used for log and time-series analytics, application monitoring, and operational intelligence use cases.
There are three key-functions of Kibana:
1. Use Kibana to explore your Elasticsearch data, and then build beautiful visualizations and dashboards
2. Manage your security settings, assign user roles, take snapshots, roll up your data, and more — all from the convenience of a Kibana UI
3. From log analytics to document discovery to SIEM, Kibana is the portal for accessing these and other capabilities
Setting Up Kibana
Step.1 Downloading
link:https://www.elastic.co/downloads/kibana
Step.2 Installing
1.unzip Kibana
2.Open command prompt at kibana/bin folder location
3.Run kibana on cmd
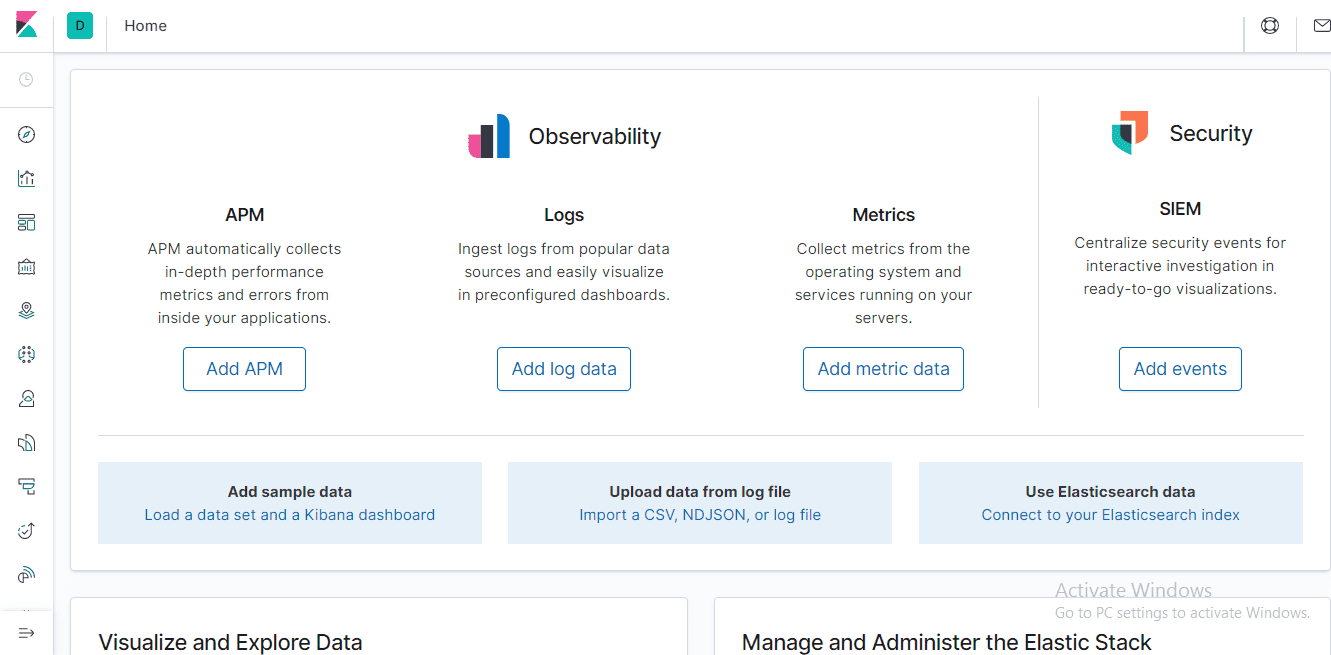
4.Point your browser at http://localhost:5601
The visualization tool is equipped with various options in its left panel, image shown following-
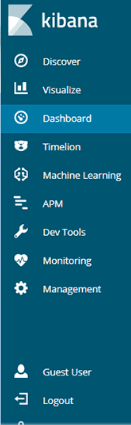
1. Discover
It enables to explore data and get answers to questions.we can access every document in every index that matches the selected index pattern in Discover.
2. Visualize
Visualize enables us to create visualizations of the data from Elasticsearch indices, which we can then add to dashboards for analysis and Kibana visualizations are based on queries of Elasticsearch.
3. Dashboards
A dashboard is a collection of visualizations, maps, and searches in real-time.
4. Canvas
Canvas is a data visualization and presentation tool. In Canvas, we can pull live data directly from Elasticsearch, and combine the data with colors, images, text, and create dynamic, multi-page, pixel-perfect displays.
5. Machine Learning
Machine learning intends to create anomaly detection jobs and observe results.
6. APM
APM(Application Performance Monitoring) system supports users to monitor the applications and services and collects deep performance metrics and errors.
7. Metrics
The metrics app enables us to monitor infrastructure metrics and identify problems in real-time.
8. Logs
Logs app in Kibana enables us to explore logs for common servers, containers, and services.
9. Uptime
Uptime allows monitoring the status of network endpoints via HTTP/S, TCP, and ICMP.
10. SIEM
The SIEM app provides an interactive workspace for security teams to triage events and perform initial investigations.
11. Dev Tools

This is a development tool that helps to interact with data in Kibana in an easy way. There are three sections in Dev tools:
1.Console:-Console enables one to interact with the REST API of Elasticsearch eg: send requests to Elasticsearch and view the response, View API documentation, Get request history.
2.Search Profiler:-Powerful Profile API which can be used to inspect and analyze search queries because response returns a large JSON blob, which can be difficult to analyze manually.
3.Grok Debugger.


Cookies are important to the proper functioning of a site. To improve your experience, we use cookies to remember log-in details and provide secure log-in, collect statistics to optimize site functionality, and deliver content tailored to your interests. Click Agree and Proceed to accept cookies and go directly to the site or click on View Cookie Settings to see detailed descriptions of the types of cookies and choose whether to accept certain cookies while on the site.


About Author
Himani Mishra
She is a backend developer with good knowledge of various technologies. She is always willing to learn new technologies and is a good learner.