Working with Graphs in Android
Posted By : Ravi Sharma | 12-Mar-2013
Android provides various libraries to draw graphs. But AndroidPlot is a fairly simple library to use.
In your project copy the androidplot library in libs folder.
The xml file is as follows-
	<?xml version="1.0" encoding="utf-8"?>

	<LinearLayout xmlns:android="http://schemas.android.com/apk/res/android"

	    android:layout_width="fill_parent"

	    android:layout_height="fill_parent" >


	    <com.androidplot.xy.XYPlot

	        android:id="@+id/graph"

	        android:layout_width="fill_parent"

	        android:layout_height="fill_parent"

	        title="Profit vs Year"/>


	</LinearLayout>
You can give any title you like depending on your requirements.
Following is the java code.
public class GraphDemo extends Activity {
public XYPlot xyPlot;
@Override
protected void onCreate(Bundle savedInstanceState) {
super.onCreate(savedInstanceState);
setContentView(R.layout.activity_graph_demo);
xyPlot = (XYPlot) findViewById(R.id.graph);
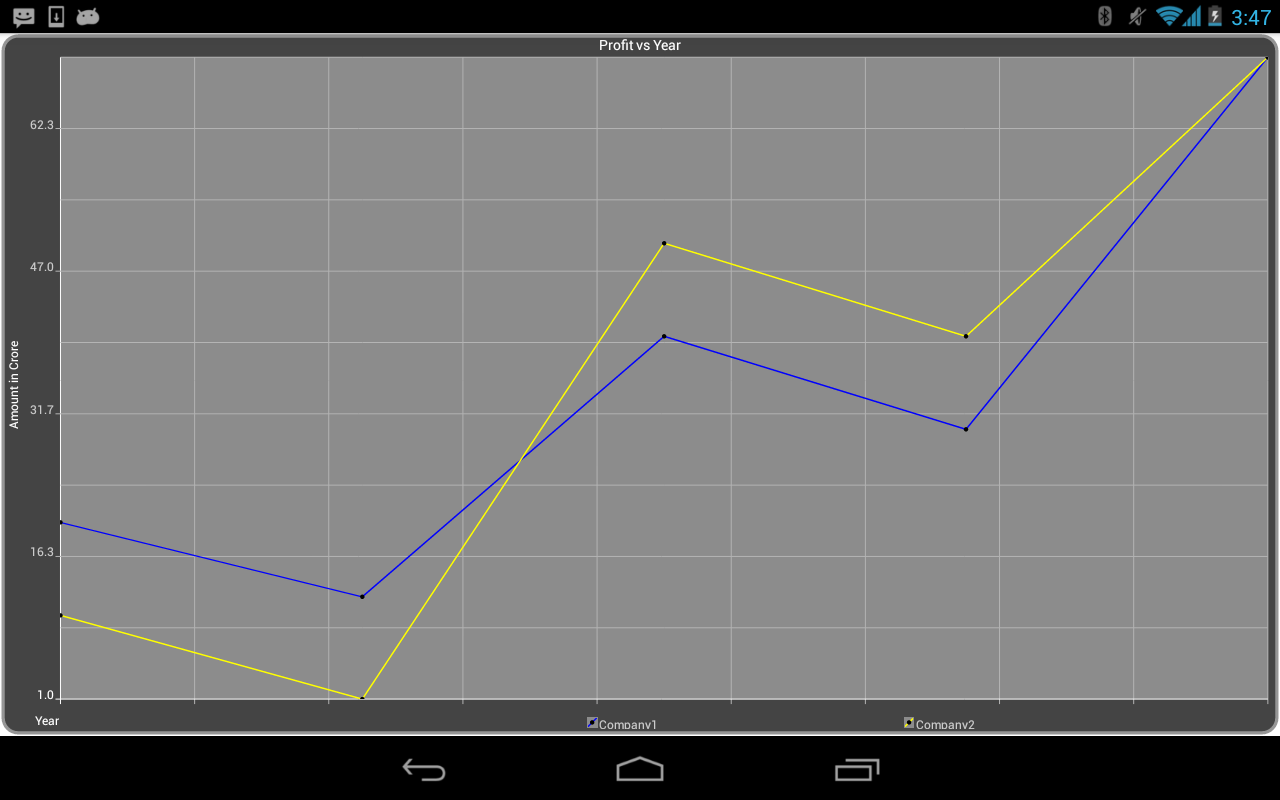
Number[] company1 = {20,12,40,30,70};
Number[] company2 = {10,1,50,40,70};
XYSeries series1 = new SimpleXYSeries(
Arrays.asList(company1),
SimpleXYSeries.ArrayFormat.Y_VALS_ONLY,
"Company1");
XYSeries series2 = new SimpleXYSeries(
Arrays.asList(company2),
SimpleXYSeries.ArrayFormat.Y_VALS_ONLY,
"Company2");
LineAndPointFormatter company1Format = new LineAndPointFormatter(
Color.BLUE,
Color.BLACK,
null);
LineAndPointFormatter company2Format = new LineAndPointFormatter(
Color.YELLOW,
Color.BLACK,
null);
xyPlot.addSeries(series1, company1Format);
xyPlot.addSeries(series2, company2Format);
xyPlot.setDomainValueFormat(new Format() {
@Override
public StringBuffer format(Object obj, StringBuffer toAppendTo,
FieldPosition pos) {
return new StringBuffer ();
}
@Override
public Object parseObject(String source, ParsePosition pos) {
return null;
}
});
xyPlot.setDomainLabel("Year");
xyPlot.setRangeLabel("Amount in Crore");
xyPlot.setTicksPerRangeLabel(2);
xyPlot.disableAllMarkup();
}
}
Code is fairly simple.
Refer the graph view by using id "graph".
Create two arrays of type Number, enter any values you want.
Then,turn the above arrays into XYSeries:
Create a formatter to use for drawing a series using LineAndPointRenderer.
First parameter gives color to line, second to points, thirs colors the area covered(better leave it as null).
Add series to xyplot.
Create as many series as number of lines you want to plot in the graph.
Lastly, give names to x, y axis.
And here is the output.


Cookies are important to the proper functioning of a site. To improve your experience, we use cookies to remember log-in details and provide secure log-in, collect statistics to optimize site functionality, and deliver content tailored to your interests. Click Agree and Proceed to accept cookies and go directly to the site or click on View Cookie Settings to see detailed descriptions of the types of cookies and choose whether to accept certain cookies while on the site.


About Author
Ravi Sharma
Ravi Sharma is an Android application developer with experience in Java , Titanium and Phonegap frameworks. Ravi loves drawing and PC games.