A Quick Guide to Data Mining
Posted By : Dimpal Bhatia | 31-May-2019
Data Mining
It is process of categorization of data into useful information by analyzing hidden patterns of data, which is assembled and collected in common areas, such as data warehouses, for purpose of efficient analysis, facilitating many information requirements to cut costs and increase revenue.
Data mining also establish relationships to solve problems through data analysis.
What is the process for analyzing data?
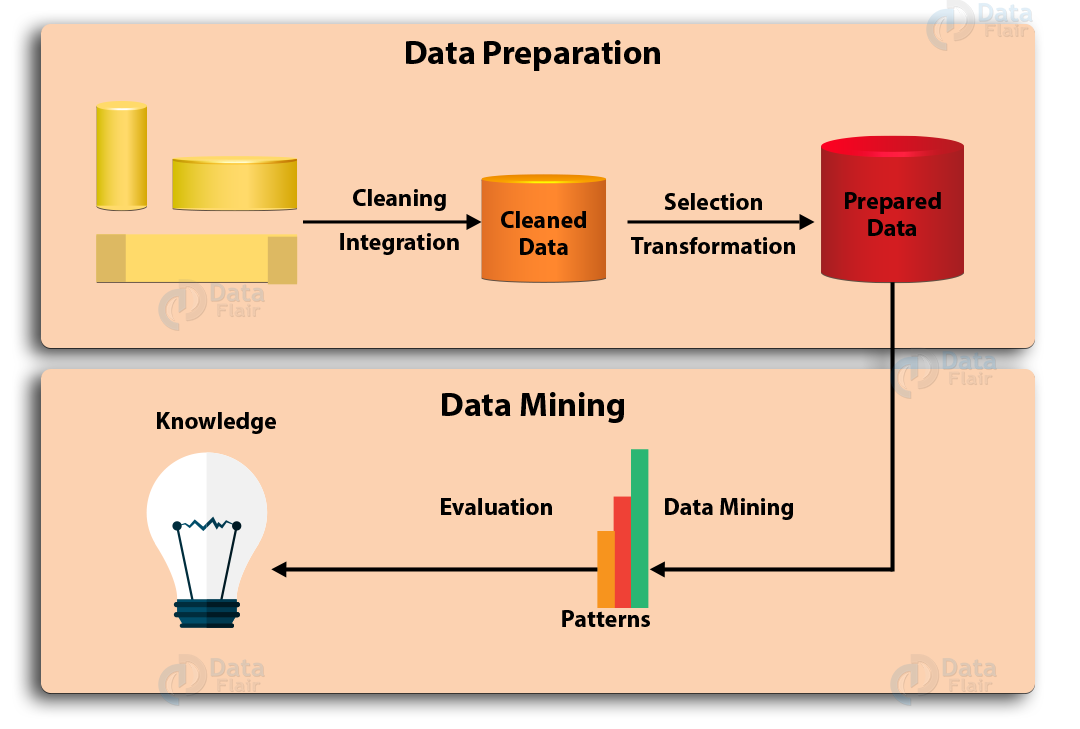
1) Data cleaning:- It removes inconsistency in data and also cleans data by removing noise that could cause problem for analyzing the data.
2) Data integration:- It is the process of combining data from various sources into single and unified view to prepare the data that needs to be analyzed. for example, if data is stored in various files or databases, it is necessary to integrate data into single file to analyze. Heterogeneous data is retrieved and combined as an incorporated form and then structure.
3) Data selection:- Data selection is defined as the process of selecting the appropriate data type and source, as well as required instruments to collect data. The process of determining suitable data for the research project can impact data integrity. It is a phase where the selected data is transformed into an appropriate form for the data mining process.
4) Data transformation:- Data transformation means converting the data usually from the source system format into the required format of a new destination system that is appropriate and can be analyzed using data mining techniques.For example, some of the data mining techniques require normalized numerical values.
5) Data mining: - This step consists of applying data mining techniques on the data to discover and analyze the interesting patterns or extract interesting knowledge from this data. Clustering and association analysis are the different techniques used for data mining.
6) Evaluating the knowledge that has been discovered:- This step consists of evaluating the knowledge that has been extracted from the data. This can be done in terms of objective and/or subjective measures.
7) Visualization:-Finally, the last step is to visualize the information that has been extracted from the data. It represents data and information in graphical form. It uses visual elements like graphs, charts , maps and data visualization tools and provides an accessible way to understand trends and patterns in data. In the world of Big Data, data visualization tools and technologies are very important to analyze large amounts of information and make data-driven decisions.
Thanks


Cookies are important to the proper functioning of a site. To improve your experience, we use cookies to remember log-in details and provide secure log-in, collect statistics to optimize site functionality, and deliver content tailored to your interests. Click Agree and Proceed to accept cookies and go directly to the site or click on View Cookie Settings to see detailed descriptions of the types of cookies and choose whether to accept certain cookies while on the site.


About Author
Dimpal Bhatia
She is a bright java developer. She has a good knowledge of JavaScript, jQuery, JSP, and ElasticSearch. Her hobbies are playing badminton and reading books