Using Jasper Reports Part 3 (Datasets and Table component in Jasper Reports)
Posted By : Nagesh Chauhaan | 25-Oct-2012
Welcome to the Part 3 of Using Jasper Reports Series. In previous articles we went through the Introduction of iReports and Building a Simple iReport . In this article, let us add some functionality to our report by adding a table and datasets .
Tables plays a very important role in every design , in iReports Tables are used to represent data in an efficient and usefull manner. Most of the time we need to iterate our dynamic data to display the output , in case of iReports this is done by Tables and Datasets .
Let’s take a brief look at how to use a Table Component to generate a simple tabular representation of data. The following are the basic steps we will take:
- Create a saperate Dataset so that we could iterate the data easily .
- Add a table component to detail band of the report , and set its basic layout and structure.
- Put Dataset variables(Fields) in table to generate desired result.
- Preview the report to see the table functionality.
Creating a Dataset
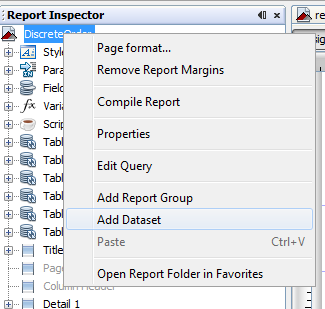
To create a Dataset , right-click on your Report in Report Inspector and choose Add Dataset :
A setup window w’ll appear like this :
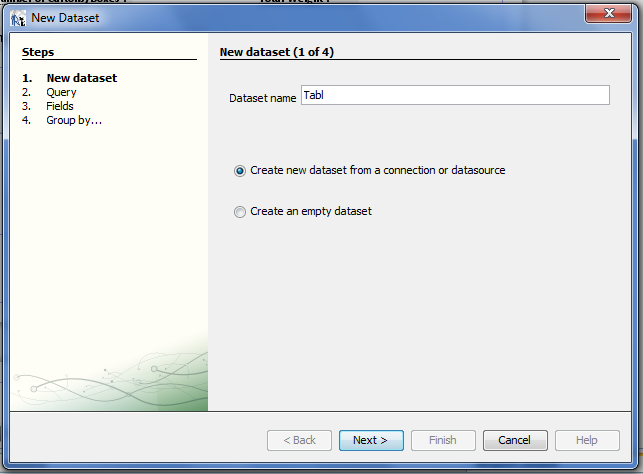
Provide a name to Dataset and let the first radio button selected for now , click next
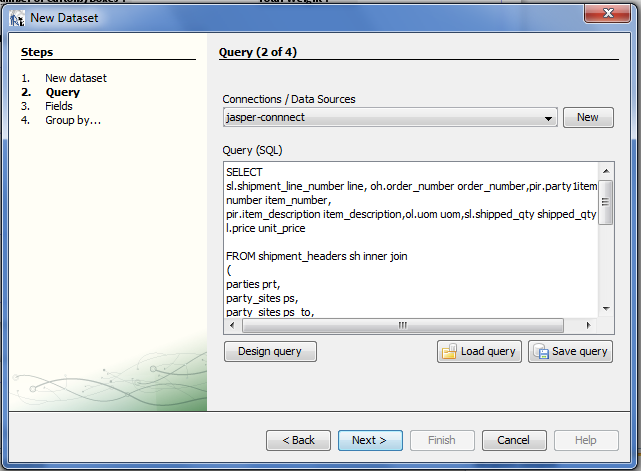
In Connections/Data Sourse select the connection that is used to your main report . Enter an appropriate query that w’ll provide us data to use in table. Now click next :
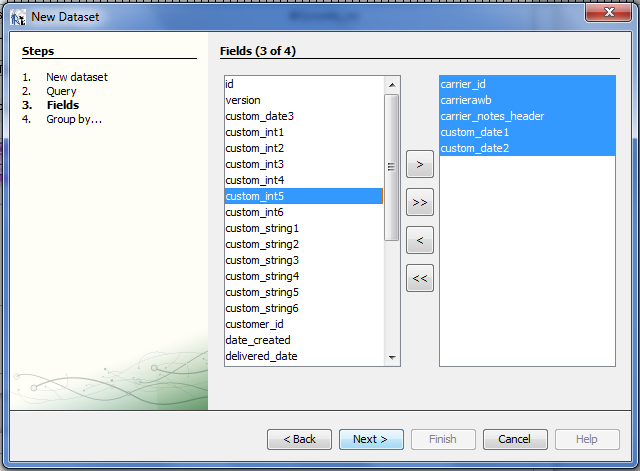
In left side of the screen designer w’ll show all the datafields that can be extracted from the query , add those fields to the right side that are going to be used in table. Now click next :
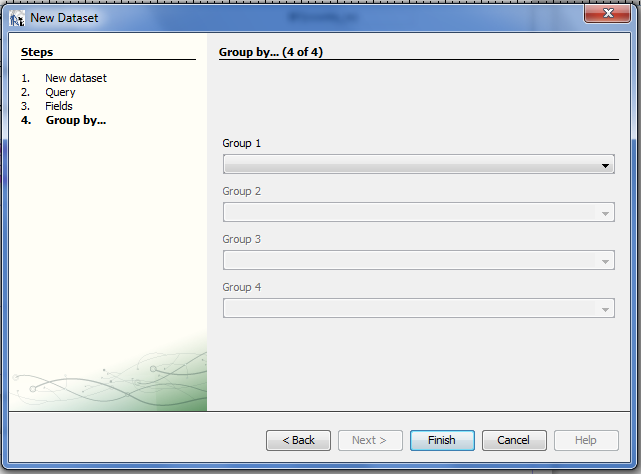
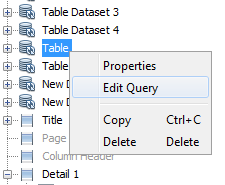
Let this page empty as it for now , and click on Finish . Here we are done with Dataset , we can review and edit it from out Report Inspector, as shown in below image :
Adding a table component to report.
Now we w’ll add a table on required position to do this go to Palatte section and select Table component :
Drop the Table component in Details Band , now a Table Wizard window w’ll pop up , like this :
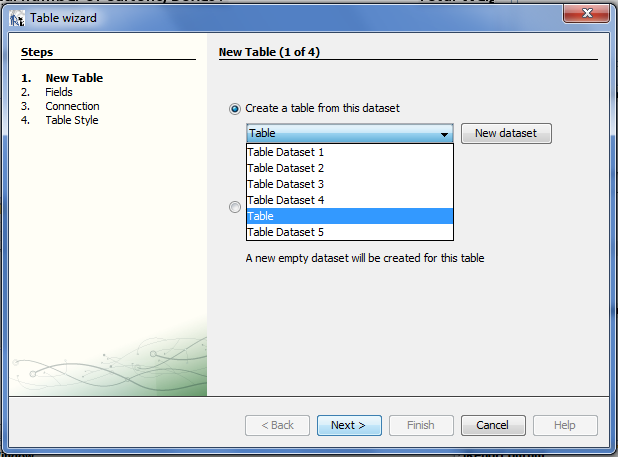
Now we need to connect our Dataset to Table , just select appropriate Dataset from drop down list and click next :
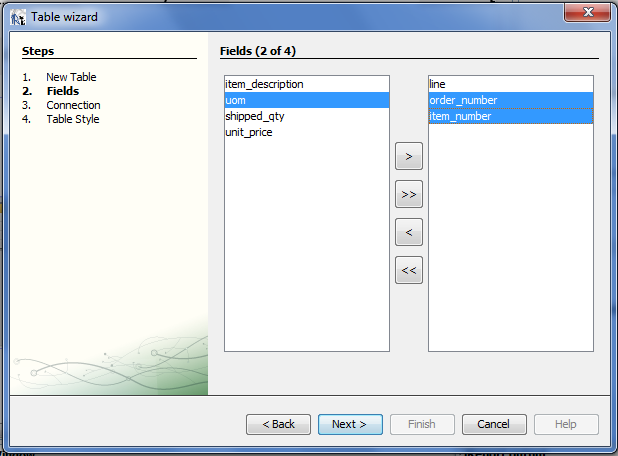
Now select Field that you want to use in your table , and click next :
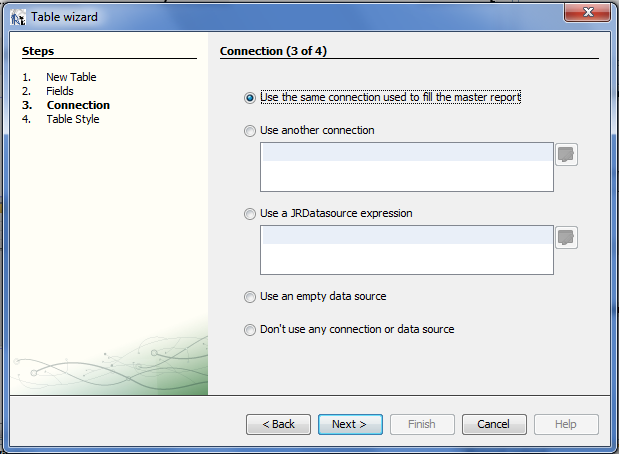
Here we can select a db connection for our Table , let the very first radio button be selected for now , click next :
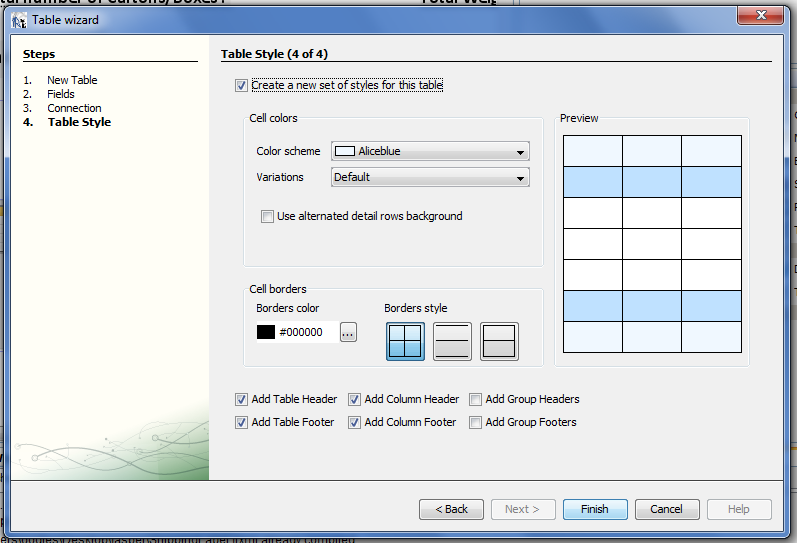
Here we can set layout and design for our table , click finish and we are done with it .After creating Table you w’ll get a Table View of Designer like this :
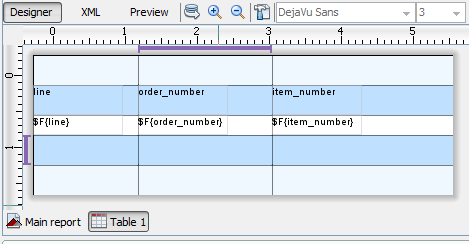
Here we can add Headings and Data Fields to our table .In Main Reporst we can see an Table Icon like this , table position in the Report can be adjust from here :
No to see the result go to Preview and you w’ll get an table added to your report , like this :
Here we are done with adding a table to our report .In next part we w'll cover How to Create a sub report and pass parameters to it.
Hope it helps !
Nagesh Chauhan


Cookies are important to the proper functioning of a site. To improve your experience, we use cookies to remember log-in details and provide secure log-in, collect statistics to optimize site functionality, and deliver content tailored to your interests. Click Agree and Proceed to accept cookies and go directly to the site or click on View Cookie Settings to see detailed descriptions of the types of cookies and choose whether to accept certain cookies while on the site.


About Author
Nagesh Chauhaan