Integration HighCharts in IOS App Using
Posted By : Vasu Saini | 16-Feb-2018
Charts and graphs are the most important components to integrate into apps, special where there is some rate of change of a quantity is going continuously. and when it comes to attractive app user interface it always comes to priority.
Highcharts is one of
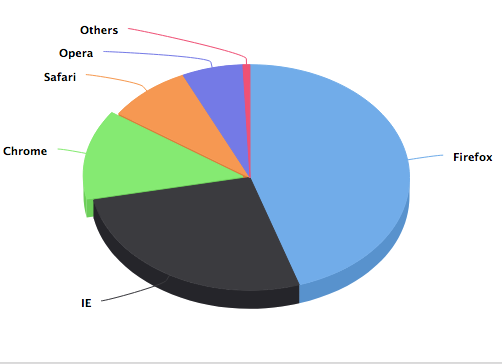
The above charts shown is Highchart and integrated in an iOS Application now let us know some steps how to integrate it in our iOS Application in Swift 4.
Step 1. Create
Step 2. After Sucessfully creation close project and install the pod mentioned below
pod 'Highcharts'
Step 3. Now open your project and create a Bridging header and name it as ProjectNameBridging-Header.h
Step 4. Now import highchart in this file as shown below
#import <Highcharts/Highcharts.h>
Step 5. Now open your AppDelegate.swift and call method in your didFinishLaunchingWithOption as show below
HIChart.preload()
Step 6. Now Take A view and set its class as HiChartView
Step 7. Now Design The ViewController Class as shown Below.
#import <UIKit/UIKit.h>
#import <Highcharts/Highcharts.h>

@interface ViewController ()

@end

@implementation ViewController

- (void)viewDidLoad {
    [super viewDidLoad];

    HIChartView *chartView = [[HIChartView alloc] initWithFrame:self.view.bounds];

    HIOptions *options = [[HIOptions alloc]init];

    HIChart *chart = [[HIChart alloc]init];
    chart.type = @"pie";
    chart.options3d = [[HIOptions3d alloc]init];
    chart.options3d.enabled = [[NSNumber alloc] initWithBool:true];
    chart.options3d.alpha = @45;
    chart.options3d.beta = @0;

    HITitle *title = [[HITitle alloc]init];
    title.text = @"Browser market shares at a specific website, 2014";

    HITooltip *tooltip = [[HITooltip alloc]init];
    tooltip.pointFormat = @"{series.name}: <b>{point.percentage:.1f}%</b>";

    HIPlotOptions *plotoptions = [[HIPlotOptions alloc]init];
    plotoptions.pie = [[HIPie alloc]init];
    plotoptions.pie.allowPointSelect = [[NSNumber alloc] initWithBool:true];
    plotoptions.pie.cursor = @"pointer";
    plotoptions.pie.depth = @35;
    plotoptions.pie.dataLabels = [[HIDataLabels alloc]init];
    plotoptions.pie.dataLabels.enabled = [[NSNumber alloc] initWithBool:true];
    plotoptions.pie.dataLabels.format = @"{point.name}";

    HIPie *pie = [[HIPie alloc]init];
    pie.name = @"Browser share";
    pie.data = [NSMutableArray arrayWithObjects:@[
                                                  @"Firefox",
                                                  @45
                                                  ],
                @[
                  @"IE",
                  @26.8
                  ],
                @{
                  @"name": @"Chrome",
                  @"y": @12.8,
                  @"sliced": @true,
                  @"selected": @true
                  },
                @[
                  @"Safari",
                  @8.5
                  ],
                @[
                  @"Opera",
                  @6.2
                  ],
                @[
                  @"Others",
                  @0.7
                  ], nil];

    options.chart = chart;
    options.title = title;
    options.tooltip = tooltip;
    options.plotOptions = plotoptions;
    options.series = [NSMutableArray arrayWithObjects: pie, nil];

    chartView.options = options;

    [self.view addSubview:chartView];
}

@end
Step 8. All Done.


Cookies are important to the proper functioning of a site. To improve your experience, we use cookies to remember log-in details and provide secure log-in, collect statistics to optimize site functionality, and deliver content tailored to your interests. Click Agree and Proceed to accept cookies and go directly to the site or click on View Cookie Settings to see detailed descriptions of the types of cookies and choose whether to accept certain cookies while on the site.


About Author
Vasu Saini
Vasu Saini is Passionate to deploy ideas into real world, Have zeal to learn new technologies. working as iOS Developer in Oodles Technologies. Sports Freak, Calisthenics ,Parkour, Love to play football, swimmer, athletics etc