Inspect your phonegap application using safari for debugging
Posted By : Deepak Rawat | 15-Dec-2014

While creating your phonegap application sometimes there are issues which are hard to debug without any debugger tool, most of these issues are related to UI, which we were able to resolve in web application by using the browser’s inspect element functionality.
But after safari 6 or greater this problem is also resolved using the safari’s web inspector, which helps to debug issue in our phonegap application and now we were able to resolve the easily.
NOTE: This method only works if the app is installed using the Xcode, there is no support for apps installed from app store.
Below are the steps to use this method:
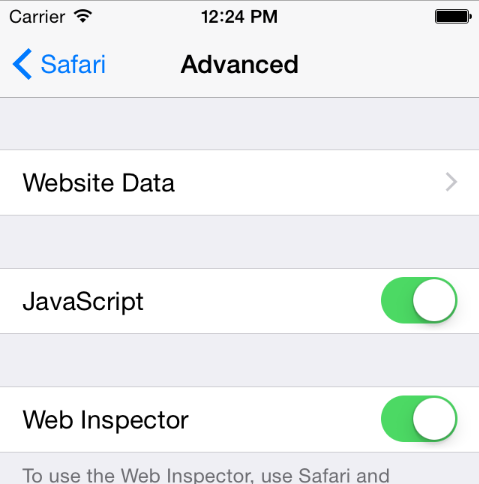
STEP 1 : Go to your safari app’s setting then go to advance tab and enable the web inspector
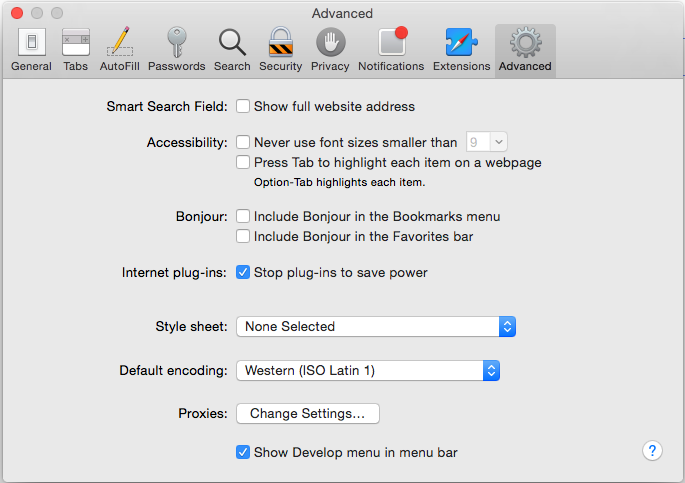
STEP 2 : Sometimes develop menu in safari didn’t show by default. For showing that go to preferences and check the “Show develop menu in menu bar”.
STEP 3 : Now, start your app in iOS simulator or in the physical device. If using your iPhone, make sure your phone is connected with your laptop or desktop with USB cable. Once the app starts, open safari and select the develop menu and find your device and find the web page entry there.
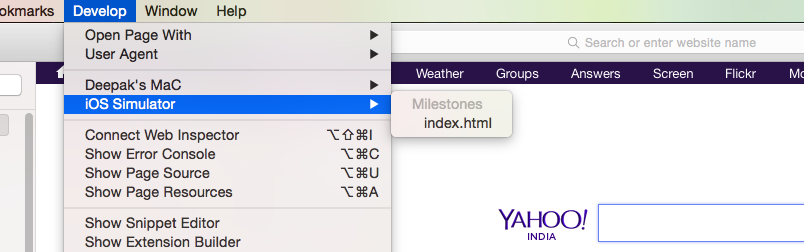
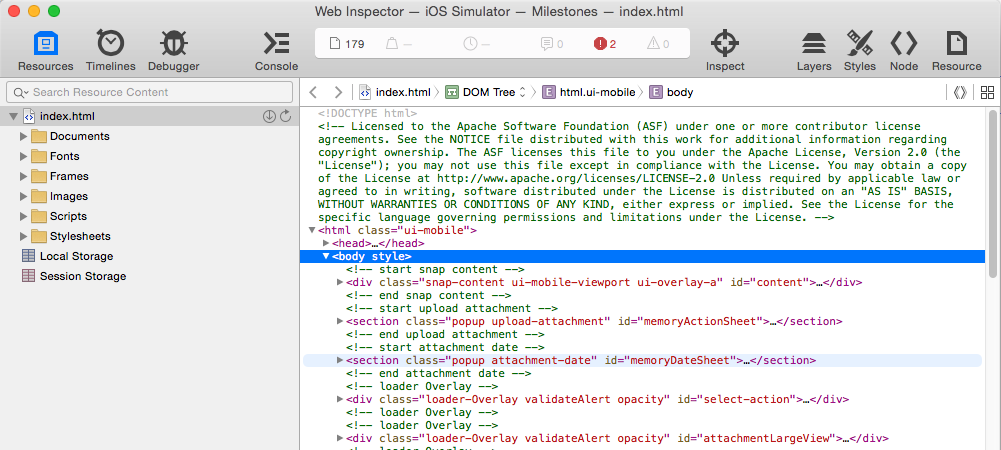
Now you can inspect your phonegap app as you were using it for web.
Note: If its not working check for the private browsing in safari privacy setting on your device.
Have fun !!!


Cookies are important to the proper functioning of a site. To improve your experience, we use cookies to remember log-in details and provide secure log-in, collect statistics to optimize site functionality, and deliver content tailored to your interests. Click Agree and Proceed to accept cookies and go directly to the site or click on View Cookie Settings to see detailed descriptions of the types of cookies and choose whether to accept certain cookies while on the site.


About Author
Deepak Rawat
Deepak is a Web and Mobile application Sr. Lead Frontend developer and good working experience with JQuery , AngularJS , Javascript and PhoneGap. His hobbies are listening to music and photography.