A Descriptive Comparison Between Mapbox and Highcharts
Posted By : Shubham Singh Rawat | 28-Aug-2020

This blog post provides a descriptive comparison between Mapbox and Highcharts. Mapbox is a complete solution for map, data and spatial analysis, whereas Highcharts provides a pure JavaScript library for charts visualisation. Read further to learn more about the former and latter.
Highcharts
Highcharts is a charting library written in pure JavaScript, offering an easy way of adding interactive charts and maps to your web application. It is solely based on native browser technologies and doesn't require client side plugins like Flash, Java etc. Furthermore you don't need to install anything on your server.
Features
Works with your stack
Highcharts’ charting libraries work with any back-end database or server stack. You can provide data in any form, including CSV, JSON or loaded and updated live. It also provides Wrappers for most popular languages, such as .Net, PHP, Python, R, and Java, as well as iOS, and Android, and frameworks like Angular, Vue and React.
Touch and mobile optimized
Intelligent responsiveness is one of the key features of Highcharts. Fitting the chart to the dimensions of its container, places non-graph elements such as labels, legends and headings in the most optimal location and many other features defines its responsiveness.
It supports various multi-touch gestures and hence provides a native experience on mobile and touch screens. For example single touch-drag for data inspection, multi-touch for zooming, and many ers may describe charts or data more.
Annotations, supporting user interaction
Developers may describe charts or data points with Annotations by simply drawing simple shapes and text anywhere on the canvas or tethered to specific data points. Alternatively, you can also build user interfaces, such as buttons, toolbars and dialogues using annotation module API which enables end-users to place their own annotations on a chart. Highcharts responsiveness takes care of placement and visibility of annotations in response to canvas/screen size at run-time.
Data processing in the browser
With Highcharts, source data can be post-processed in the client in order to improve the user experience. From version 8 and onward, you may enable marker clusters to your scatter series type of charts, and choose from clustering algorithms. Another nice data processing feature is the ability to sort data, regardless of whether the data source is sorted.
Dynamic
Numerous events supply hooks for programming against the charts, making it easy to demonstrate and extend complex relationships between data with live, dynamic updates of data and customizable animations. Data can be handed over to Highcharts in any form and even from a different site, simply a callback function used to parse the data into an array.
Applications
Highcharts provides 4 different data driven chart APIs for charts, Stocks, Maps and Gantt charts.
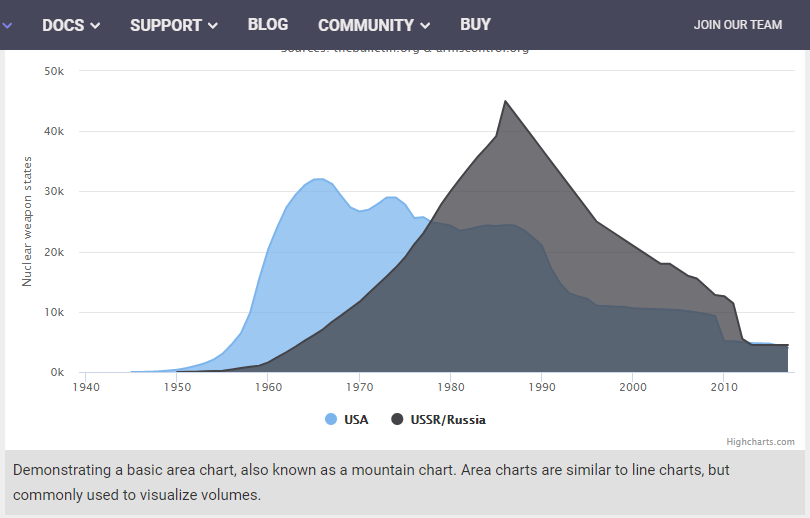
Area Chart
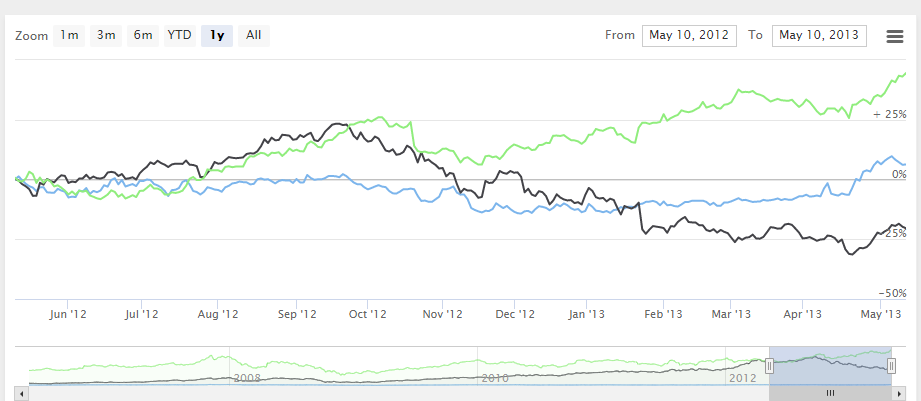
Stock Chart
- Highcharts Stock is independent of any external dependencies, nor are data routed via our servers prior to rendering. You control the entire flow of data from your web or mobile app. Use Highcharts Stock on your password protected websites without worrying about any man-in-the-middle siphoning your data.
- It provides a way to view a certain time range by providing a range selector where the user can zoom in on preselected time ranges like 1m, 1y or YTD, or custom date ranges. Furthermore, Highcharts Stock intelligently determines where to place the ticks so that they always mark the start of the month or the week, midnight/midday, the full hour etc. Additionally, it is easy to add tooltip text with information on each point and place event-markers and annotations directly related to data-points.
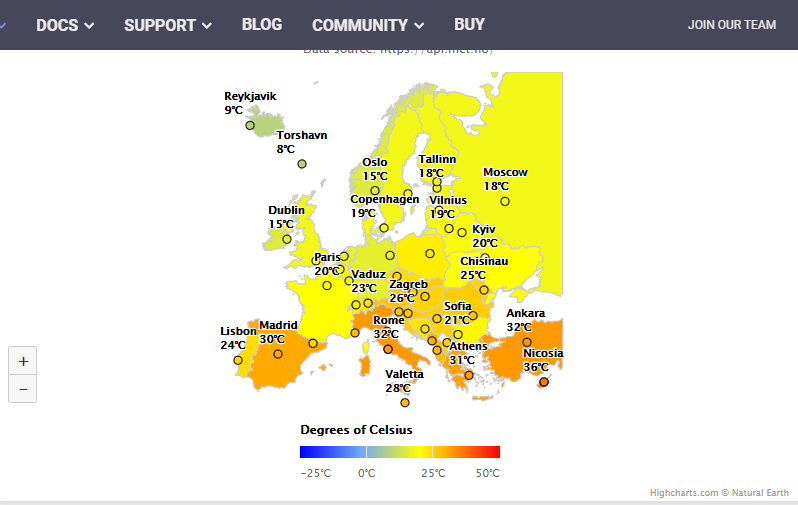
Maps
- Highcharts provide numerous kinds of maps, all optimized for fast download and rendering with Highcharts Maps. For the convenience, the map collection is also available via NPM.
- Maps are just shapes defined by SVG so its easy to create custom maps, such as this regular map of a made-up place, or this irregular map of a real place.
- Besides the common Series/Point concept, Highcharts Maps accepts the standardized GeoJSON (as well as TopoJSON) format for map input.
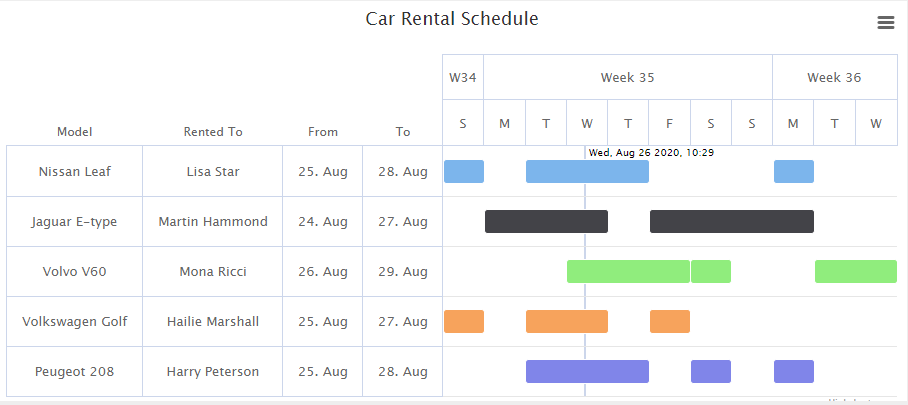
Gantt Chart
- Highcharts Gantt is designed to help developers quickly create any kind of Gantt-style user interfaces and visualizations for their applications.
- Gantt charts play a major role in project planning management applications. It also offers great utility in many kinds of asset allocation and logistics, from scheduling resources such as rooms, vehicles, personnel, etc. It can even be used for personal planning tasks from meal planning, scheduling car-pooling and taking kids to after-school activities, to planning your workout.
- Highcharts Gantt does not require proprietary desktop solutions, Applets or Flash in order to bring its charting capabilities to your projects. It works in any web browser (including legacy browsers), desktop and mobile, and can also be converted into desktop applications via open source solutions like Electron.
Mapbox
Mapbox is a developer platform used across industries to create highly customized applications that require solution for maps, data, and complex spatial analysis. Mapbox's tools support every part of the web and mobile map-making process.Mapbox provides multiple tools for integrating your maps into a website or custom application. It provides a WebGL based javascript library named Mapbox-GL JS, which is used for creating interactive, customizable maps from Mapbox styles and vector tiles.
Using Mapbox GL JS, you can create highly customizable maps for your web applications. A complete list of facilities provided by Mapbox is given in its API reference https://docs.mapbox.com/mapbox-gl-js/api/ . You can also examine some used cases given here https://docs.mapbox.com/mapbox-gl-js/examples/ .
Usages
Display customized data points.
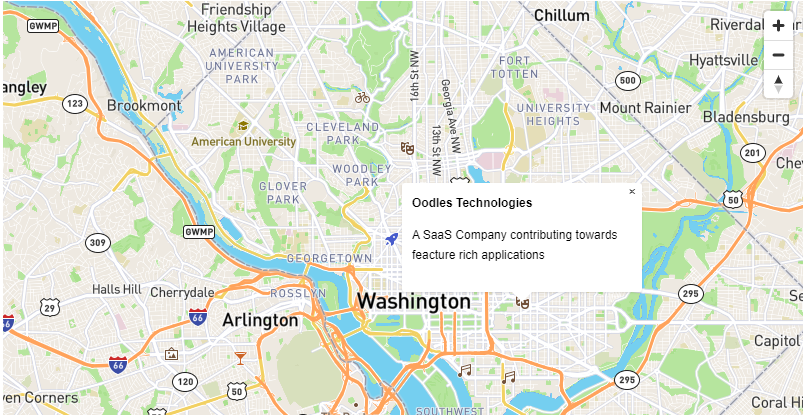
You can create points on map, clicking on which lead to a box containing custom point description.
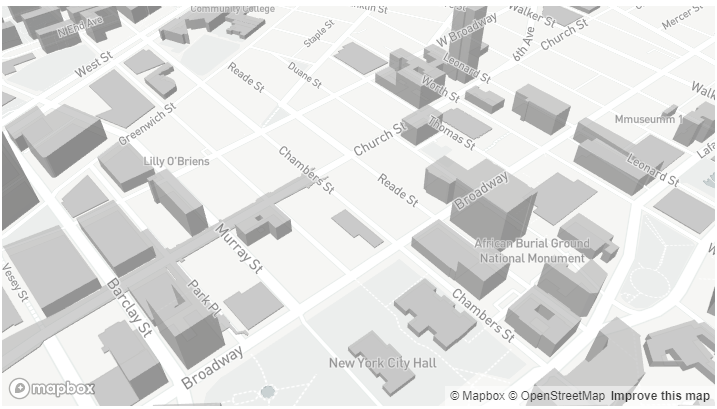
Create 3D Map visualizations
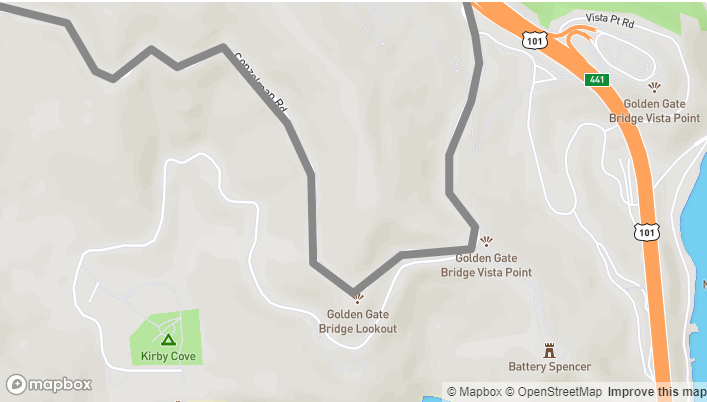
Add a GeoJSON line
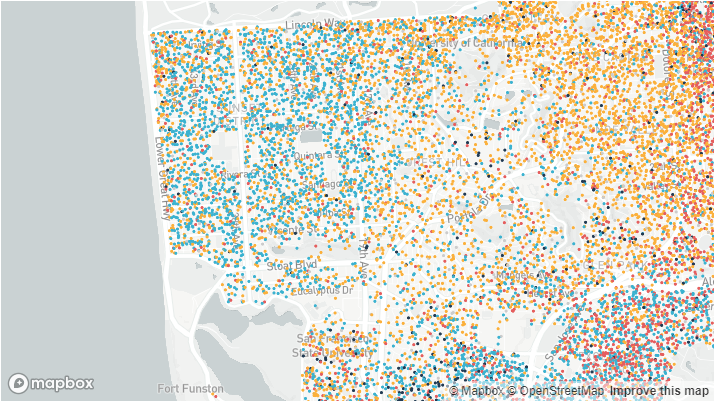
Creating a visualization with a data expression
Advantages
Mapbox is easy to set up, and offers similar and even better functionality(in some cases). Plus, you can create custom maps according to the look of your site or brand.It has wider and deeper range of maps customizations which is not available in other maps data visualisation service/libraries.
We are a 360-degree SaaS app development company that provides end-to-end software development services with a focus on next-gen technologies. Our development team specializes in using JavaScript technologies like Angular, Node, and ReactJS to build scalable, responsive, and feature-rich web applications. We also have a dedicated team of Full Stack developers that are capable of performing both frontend and backend tasks. Our SaaS application development services address your mission-critical project requirements through high-quality web and mobile applications that are easy to scale.


Cookies are important to the proper functioning of a site. To improve your experience, we use cookies to remember log-in details and provide secure log-in, collect statistics to optimize site functionality, and deliver content tailored to your interests. Click Agree and Proceed to accept cookies and go directly to the site or click on View Cookie Settings to see detailed descriptions of the types of cookies and choose whether to accept certain cookies while on the site.


About Author
Shubham Singh Rawat
He is a technical enthusiast who has keen interest in full-stack web development. He has good experience using java(springboot) in back-end and reactjs in front-end.