How to run JMeter in non GUI mode
Posted By : Aditi Nahar | 18-Dec-2017
Apache Jmeter is an open source performance testing tool. It is used to carry out load and performance tests for many different servers. It has a simple and user friendly GUI through which new elements, thread groups and samplers can be added and result can be viewed through different listeners.
However, there are some limitations with JMeter in GUI mode, like
a) After a certain limit (of threads/users), JMeter crashes.
b) CPU utilization slows down.
c) Usage of multiple listeners affects its performance.
So to avoid these issues and to drive more requests per second, JMeter scripts can be run in non GUI mode. Once the script is done and verified in GUI mode, it is better to move to non GUI mode for execution.
Running JMeter in non GUI mode is very easy. Let's understand how we can do that:
1.Just remember the below syntax:
<JMeter path> jmeter -n -t <script location> -l <logfile location>
-n --> specifies Jmeter in non GUI mode
-t --> specifies JMX file that has the test plan
-l --> specifies JTL file that logs test results
-j --> specifies Jmeter log file name.
2. Check the test results:
After the test is complete, JTL file will be generated inside apache jmeter bin folder.
The file can be viewed in 2 ways either by opening the file on the terminal itself or in JMeter GUI mode.
Let's understand it here with an example:
Step 1:
Reach to JMeter bin folder.
Step 2:
Save JMeter script in the folder.
Step 3:
Run the syntax on terminal
./jmeter.sh -n -t TestScript.jmx -l test11.jtl &
Step 4:
Once the JMeter test is complete, the following will be displayed in nohup.out file which is created inside bin folder:
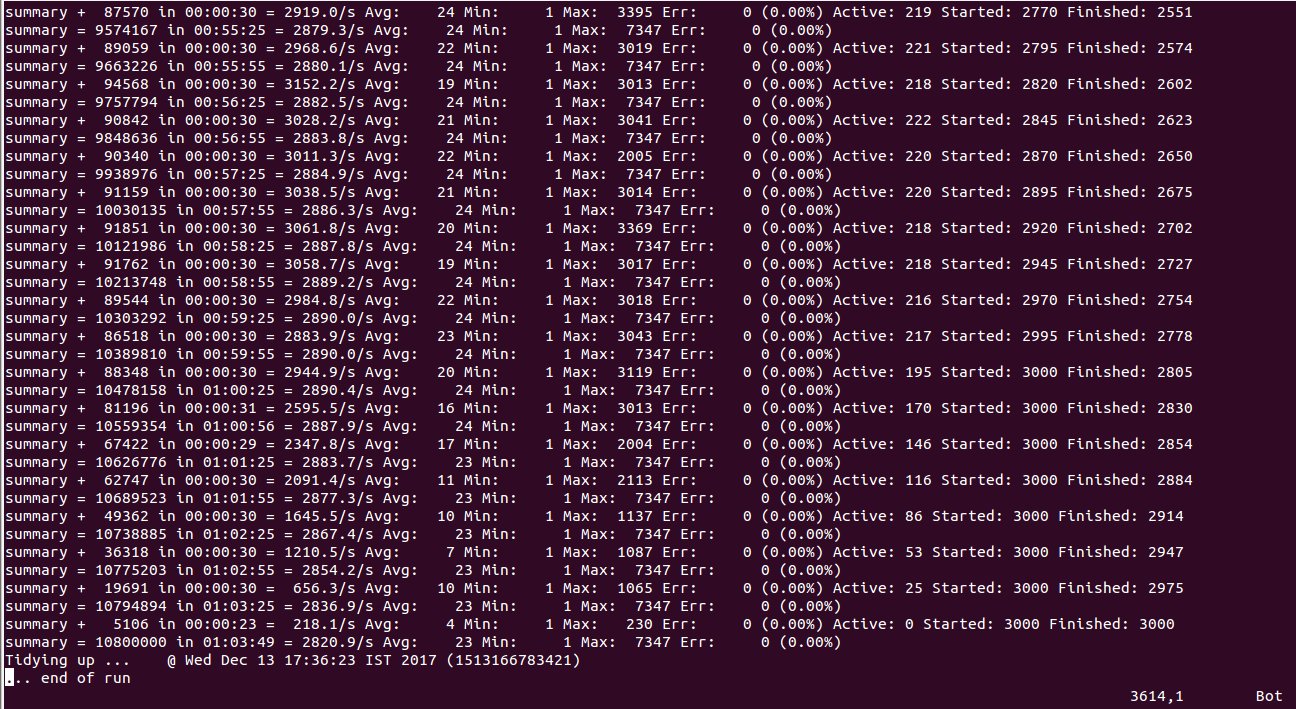
Let's see the stats and understand what they tell us:
87570 in 00:00:30 = 2919.0/s - means in 30 seconds 87570 requests send to server with an average throughput of 2919 requests per second.
Avg: 24 - means average response time at that time is 24 milliseconds.
Min: 1 - minimum response time for that period is 1.
Max: 3395 - maximum response time for tht period is 3395.
Err: 0(0.00%) - means no errorin requests for tht period and % of error from total request is zero.
Active: 219 - no. of active users performing requests.
Started:2770 - no. of started threads from the begining of test.
Finished:2551 - total no. of threads finished fro m the beginning of test.
Hope this blog will help you out.
Thanks
Happy Testing.


Cookies are important to the proper functioning of a site. To improve your experience, we use cookies to remember log-in details and provide secure log-in, collect statistics to optimize site functionality, and deliver content tailored to your interests. Click Agree and Proceed to accept cookies and go directly to the site or click on View Cookie Settings to see detailed descriptions of the types of cookies and choose whether to accept certain cookies while on the site.


About Author
Aditi Nahar
Aditi is a certified QA Engineer with a strong command over management tool sets like JIRA and Trello, as well as QA tool sets for API and performance testing. She possesses excellent verbal and written communication skills and has gained valuable experience in management and leadership while collaborating with clients and large teams. Aditi's ability to apply creative thinking and problem-solving skills makes her adept at handling challenging business scenarios. Her proficiency in manual testing has proven instrumental in identifying issues and ensuring the functionality of applications across web, mobile, and TV platforms. She has made significant contributions to both internal and client projects, including Bits2Btc, AUS-BTC, EZBitex, ACL EAP, Scaffold, Iron Systems VRP, Oremus Zoho, and NOWCAST OTT.