Highlights on data visualization
Posted By : Palak Sharma | 22-Jan-2018
"Data visualization"
After hearing this term we all may have a question in our mind what is it. Well, as technologies are growing, we are having a large amount of collection and huge chunks of data to maintain and recollect, so the data visualization is the presentation of data in a graphical or pictorial format. It allows the organizers to see the analytics visually and identifying the new patterns and grasp the difficult outcomes from the data.
The concept of using pictures to display a piece of information is been used since our ancient days. We have evaluate ourselves from using maps and graphs from 1700's to pie chart in our early 1800's. The great boom which came is with computers, computers made it possible to manage a large amount of data at lightning fast speeds. Today the data visualization has paddled its own canoe that in all together will certainly change the corporate landscape over the next few years.
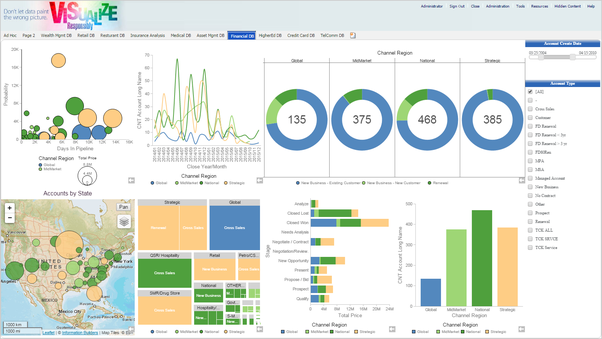
With evolving data science, data visualization has become an integral part. The question arises now is why only data visualization, well the way our human brain process is in terms of pictorial representation, so it is much more convenient to understand a large amount of data in the form of graphs and charts rather poring them over the spreadsheets and text documents.
Technologies which we refer to have the data visualization. There are two main categories of data visualization:-
a) Visual Reporting:- Visual reporting use charts and graphics to represent business logics. The dashboard and scoreboard are the primary types of visual reporting data representation which gives a user a visual snapshot of performance.
b) Visual analysis:- With the visual analysis the user can able to compare and co-relate data at the speed of thought. Its stores and compress the data in the memory providing sub seconds response against the action taken with data.
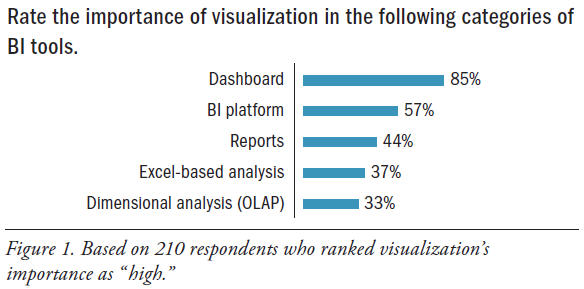
We at oodles create very highly scalable, cost-effective can manage data chunks of our customers business needs.
Our team is doing continues research on this to make data visualization techniques to integrate with real-time business needs.
If you have any question, queries or project in mind contact us on [email protected]


Cookies are important to the proper functioning of a site. To improve your experience, we use cookies to remember log-in details and provide secure log-in, collect statistics to optimize site functionality, and deliver content tailored to your interests. Click Agree and Proceed to accept cookies and go directly to the site or click on View Cookie Settings to see detailed descriptions of the types of cookies and choose whether to accept certain cookies while on the site.















About Author
Palak Sharma
Palak is enthusiastic and passionate about coding , Her areas of expertise in coding languages are JavaScript and angular , html and css .